

Are Midcaps really overvalued?
Are Midcaps really overvalued?
Analysing Midcap 150 Index valuations in comparison with NIFTY 50

Hi,
Recently, we have heard tons about Midcap stocks having run up quite a bit and thus might be in the range of over valuation and at the same time we also have the euphoria in the market that they’d continue to perform especially since they are still doing well.
Well, so why not, let’s just look at some data points here which are the Midcap valuations as compared to large cap valuations and the excess returns Midcap 150 has given over and above NIFTY 50 and see where it leads us?
Let’s begin
Setting the context
The idea here is simple, compare valuations of Midcap 150 index with NIFTY 50 Index which have high correlation and see if they can be used as a predictor of forward returns
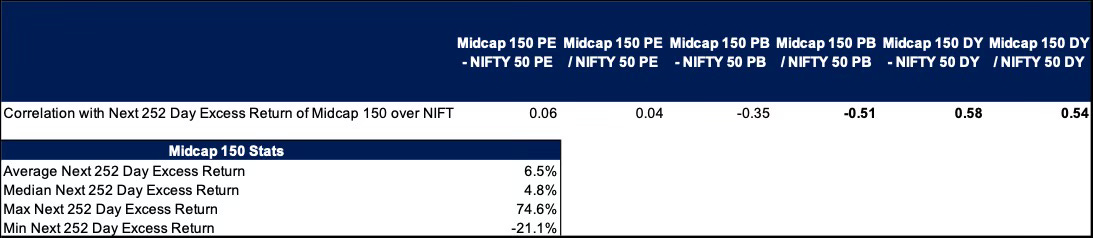
Basis the summary stats, the highest correlation of the excess return of Midcap 150 over NIFTY 50 is through comparing the PB Ratio of the both indices, and the Dividend Yield (difference between the yields and the ratio).
The data which is from 2007-2023 shows a 5% median excess return of Midcap 150 index over NIFTY 50.
Let’s go deeper here into the return distribution on the above three ratios, skip below for
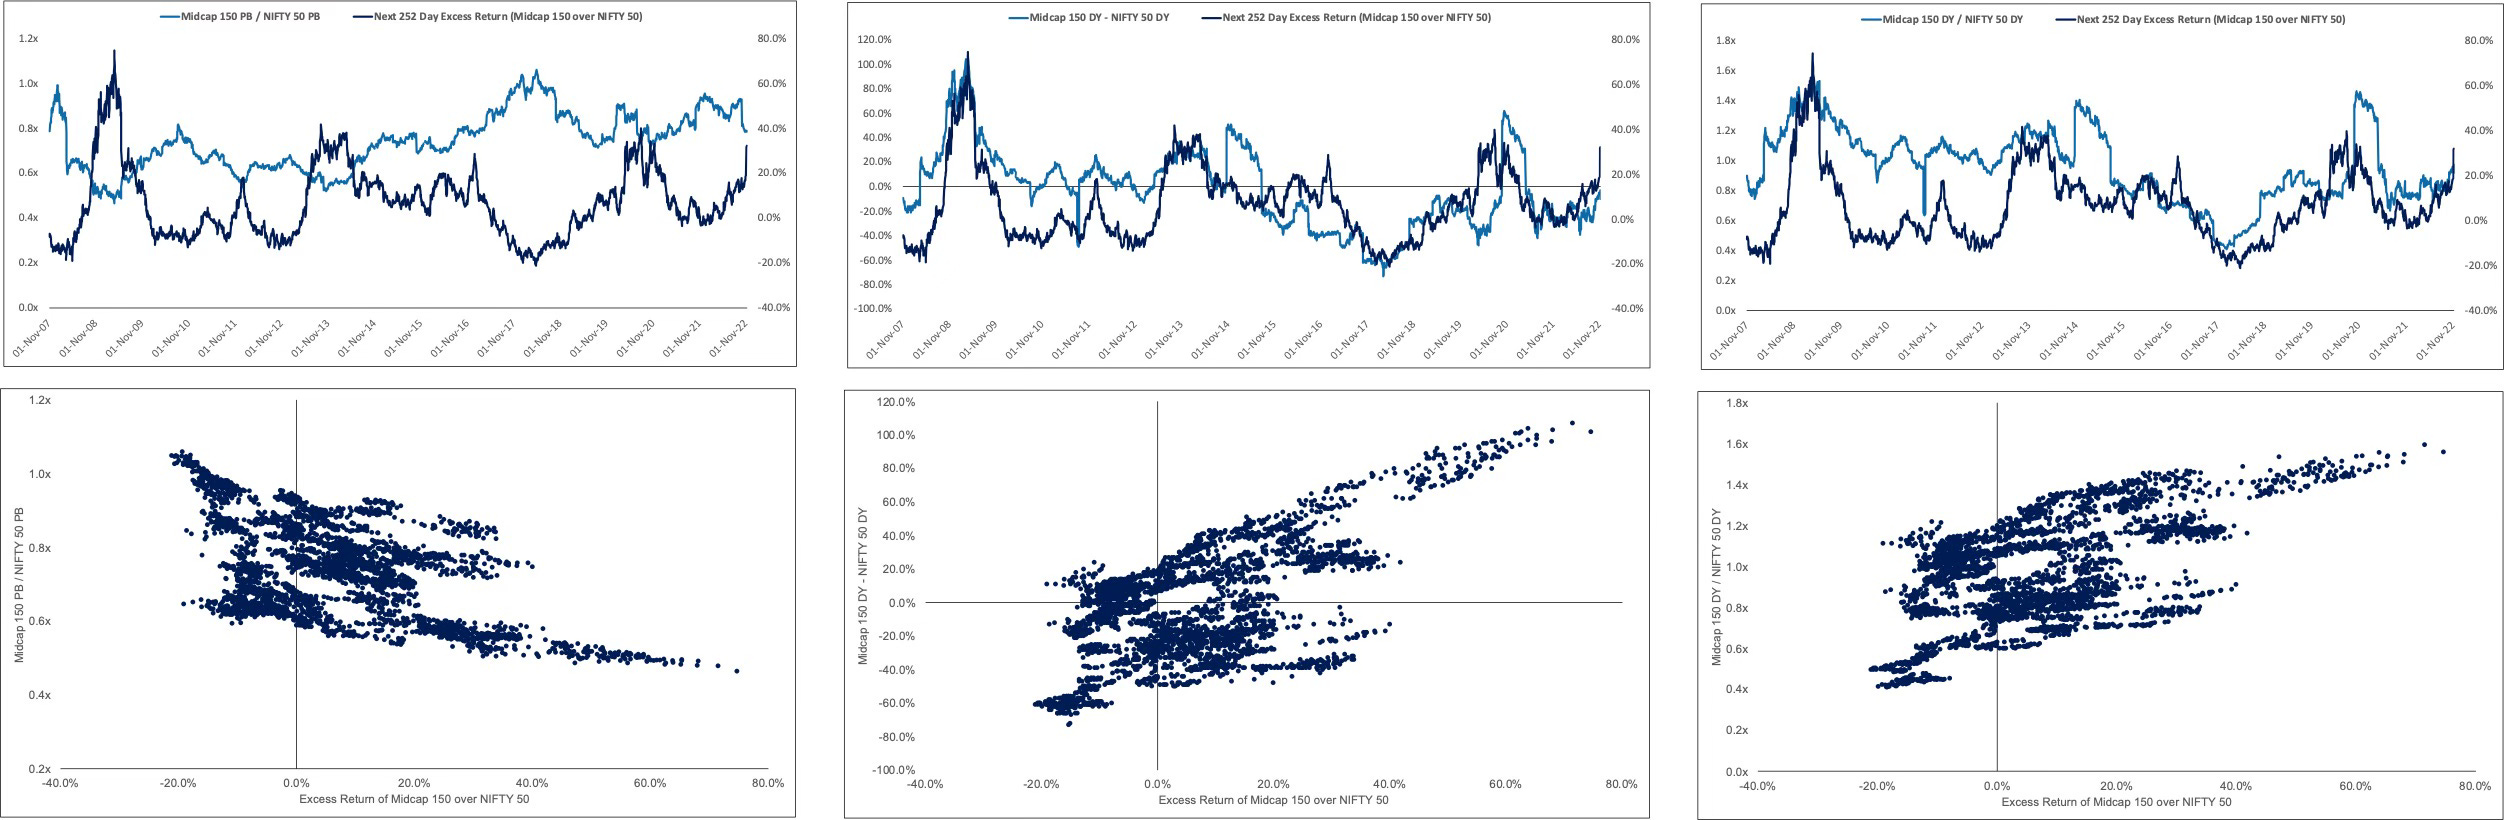
Now, none of the correlations are particularly strong here, and the scatter plot of DY does seem to be quite spurious (i.e, not that clean)
In fact, digging into returns, the min return doesn’t fit into the < SD -2 Bucket of DY ratios, showing that it isn’t the most reliable indicator despite having a higher correlation than the PB ratio.
However, this isn’t the case when we look particularly into the ratio of PB of both the indices, which seems to be a bit more robust.
So well, that’s where I’m going to focus on.
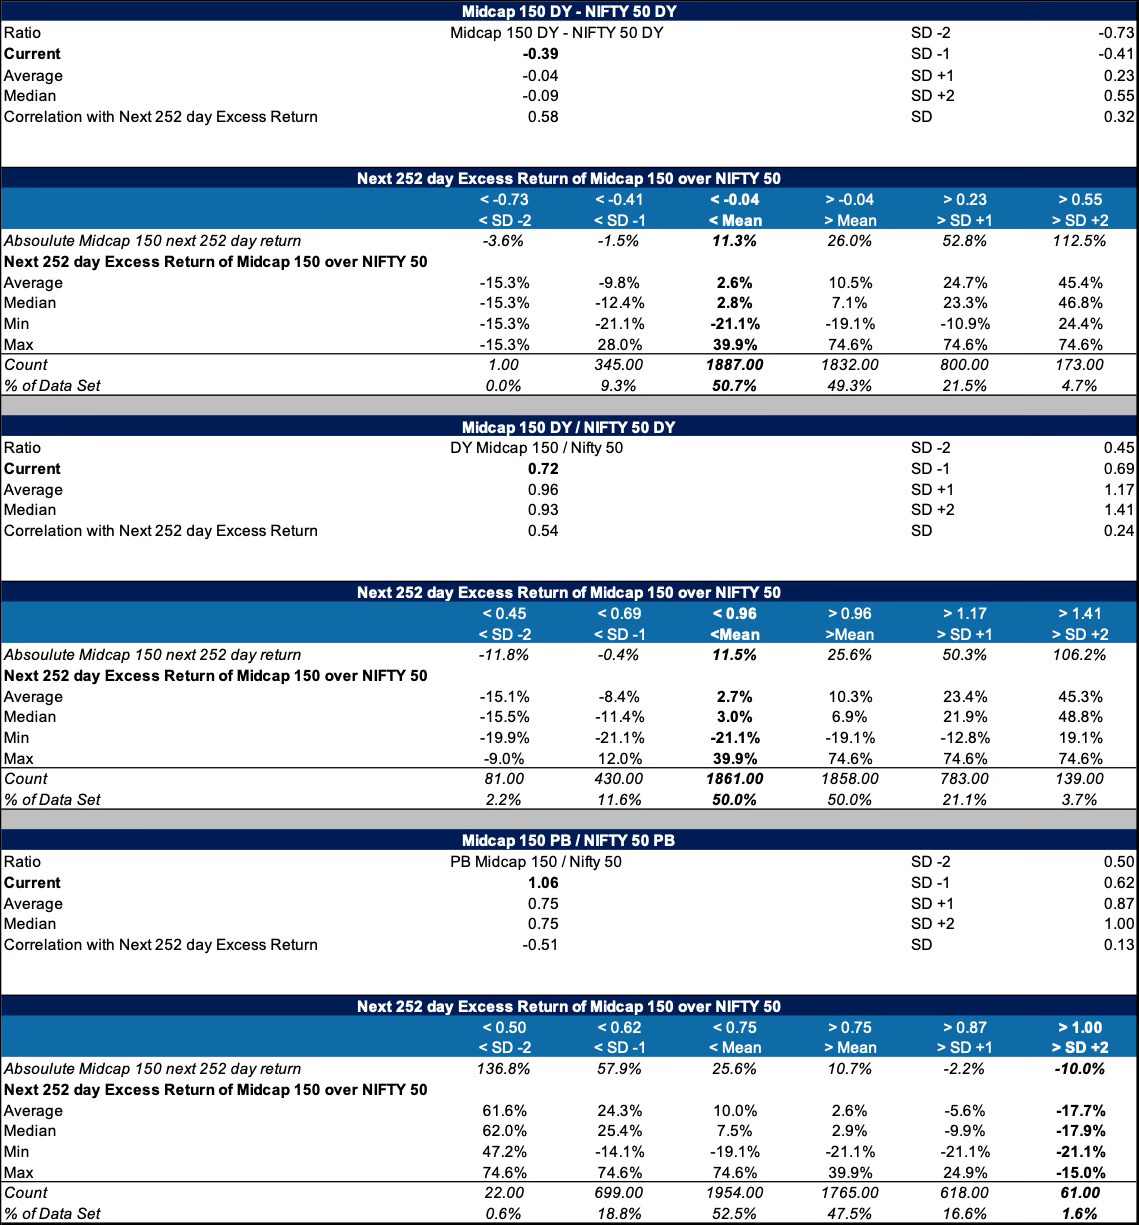
Looking at the PB of Midcap 150 as compared to PB of NIFTY 50, one thing does seem clear, it’s quite overvalued and is signally a negative forward return to the tune of negative 17-18% excess return (as compared to +5% what Midcap 150 usually gives), in fact, in this territory, it has never given a positive return in the dataset.
And although we removed DY as a robust indicator, they also were more in the negative bias territory and signalling a excess return of 2-3% - again as compared to average of about 5%, signally underperformance.
Conclusion
So what do we do here?
Let’s look at what we know:
All the ratios signal a negative bias for Midcap 150 outperforming NIFTY 50
None of them are that robust
Now, investing is probabilistic, where it’s always better to err on the sign of caution and not lose money (i.e reduce your type 1 error of making bets which can make you lose money)
Now would I take a bet of exiting midcaps all the way just because the forward returns at these relative valuations have been negative? Nah, that’s too rash, especially if your horizon is of long term, i.e easily 3Y+
But would I be cautious in deploying larger sums to midcaps and reduce my allocation to them? Probably
Like always, indices aren’t a reflection of what can happen in individual stocks, but re-visiting thesis and looking at allocations is always helpful.
Overall, not that keen on midcaps at this point.
Until next time, keep manifesting wealth.
Over the past 3 weeks, we have talked about:
NIFTY 500’s valuation given the spread between it’s earning yield and the US10Y (which is now back to being positive btw)
Private Bank Valuations
Sectoral themes we believe can play out well


Disclaimer 1: All above views are purely for educational purposes and are not to be taken as investment advice. Investment or trades taken of any kind based on this are solely the person’s risk and I bear no liability. Please consult a financial advisor before making any investments. All investments are subject to market risks.
Disclaimer 2: The views presented above are mine and not of any organization(s) I work with / am employed at
Disclosure 1: I might be exposed to some or all the themes mentioned above, please do consider everything here as biased.
Sources:
NIFTY Indices