

Data Insights: US-India 10Y Spreads and Index Returns - 12th Mar'23
Data Insights: US-India 10Y Spreads and Index Returns - 12th Mar'23
All views are personal and for educational purposes only, please do your own research before investing and trading

Hi,
This month’s data insights have really gotten me excited and is probably the most fun data-related finance article you’d read this month.
We are diving deep into the relationship between US-India 10Y Spreads and the returns of India’s NIFTY50, which might help us understand how the market would move!
Introduction
Before we begin, let’s understand 2 financial theories that’d help understand this article better:
Mean reversion: If you’ve been in markets for a while, you’d have heard this term quite frequently, in simple words, it basically means things tend to move towards the average over time, and any deviations from the mean usually correct over time. Unless of course the underlying factors have changed.
Utility: While this is a micro-economics concept, in finance (which is, fun fact, a subset of economics that has since branched off), usually we describe utility as pretty much how happy would an investor be with the return for the risk taken given their risk aversion
Okay Ary, I get why you mentioned mean reversion since you use data all the time, but how does utility fit in here?
Well, why would an investor shift from bonds to equity even though it’s risky?
“For a higher return” - yes, but what if that return seems too less for the risk?
“I won’t invest” - what’d would you do with that money then?
“FD, bank, maybe a debt fund, ah I see, I’d prefer debt over equity, because I’d not be happy with my return expectations”
Yup, and well everyone’s risk aversion is different, however at some point, there is a time where the market goes:

Some still refuse though, but you get the point.
Now we do understand that markets are connected and well money moves across the world.
So, what would happen to the stock markets when the spread between US and India’s 10Y govt. yields narrow or widen? - that’s what we are finding out today!
US-India 10Y Govt. Bond Yield Spread
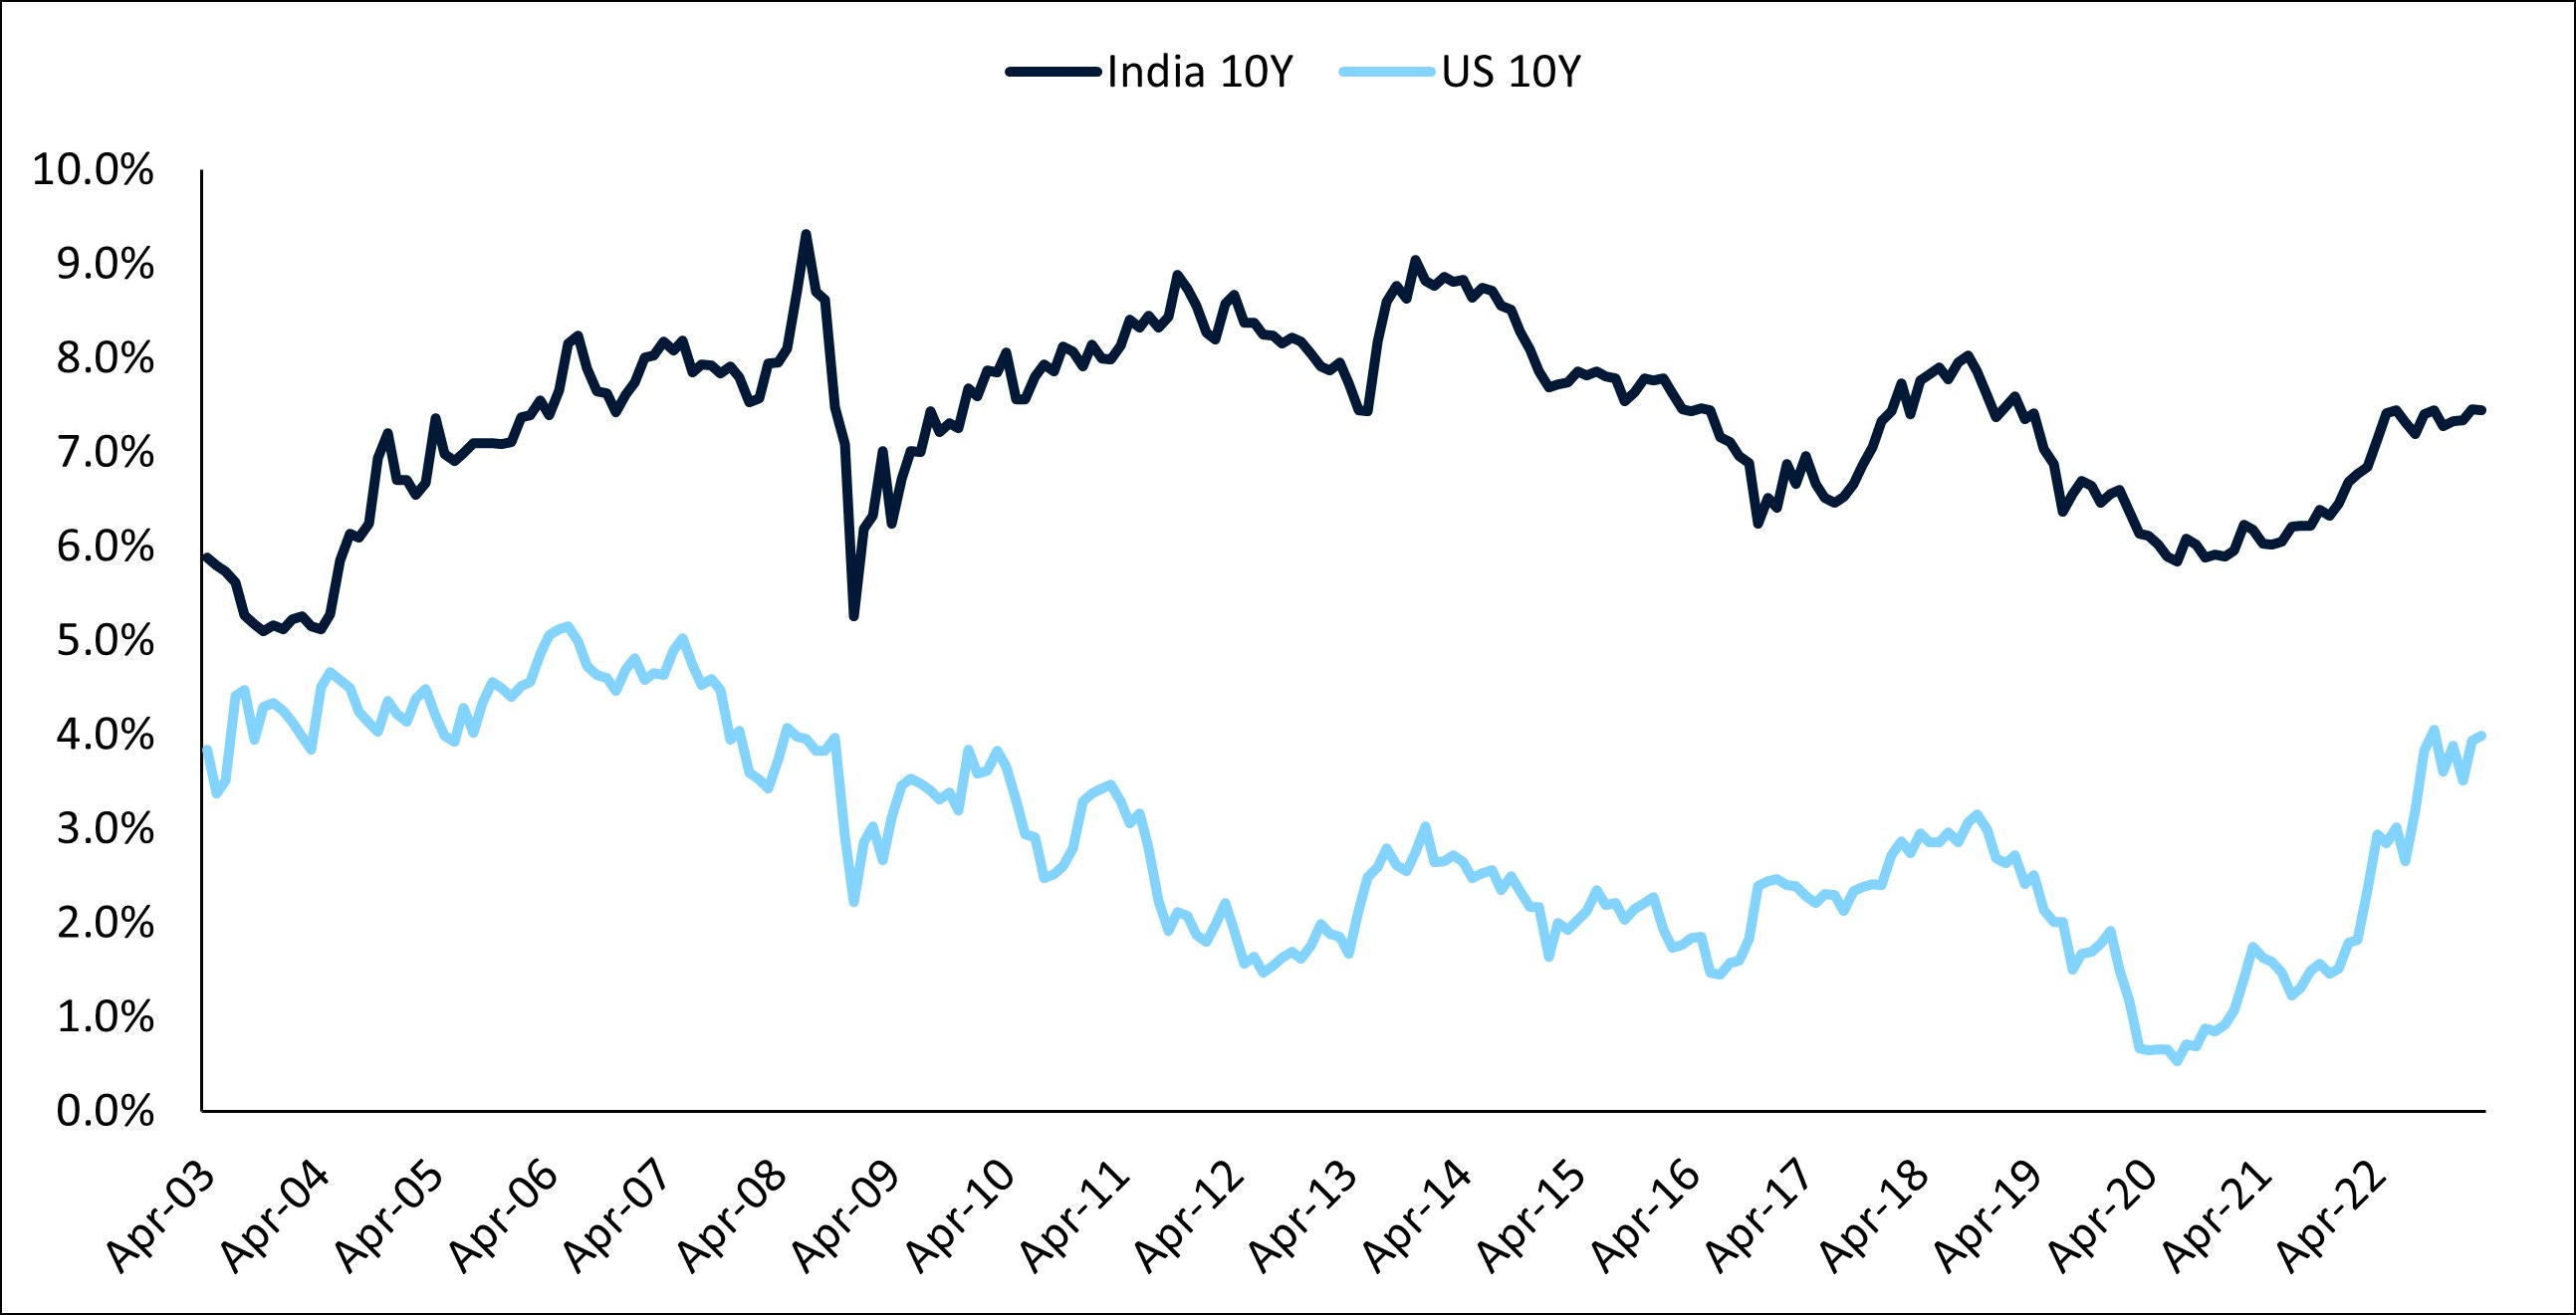
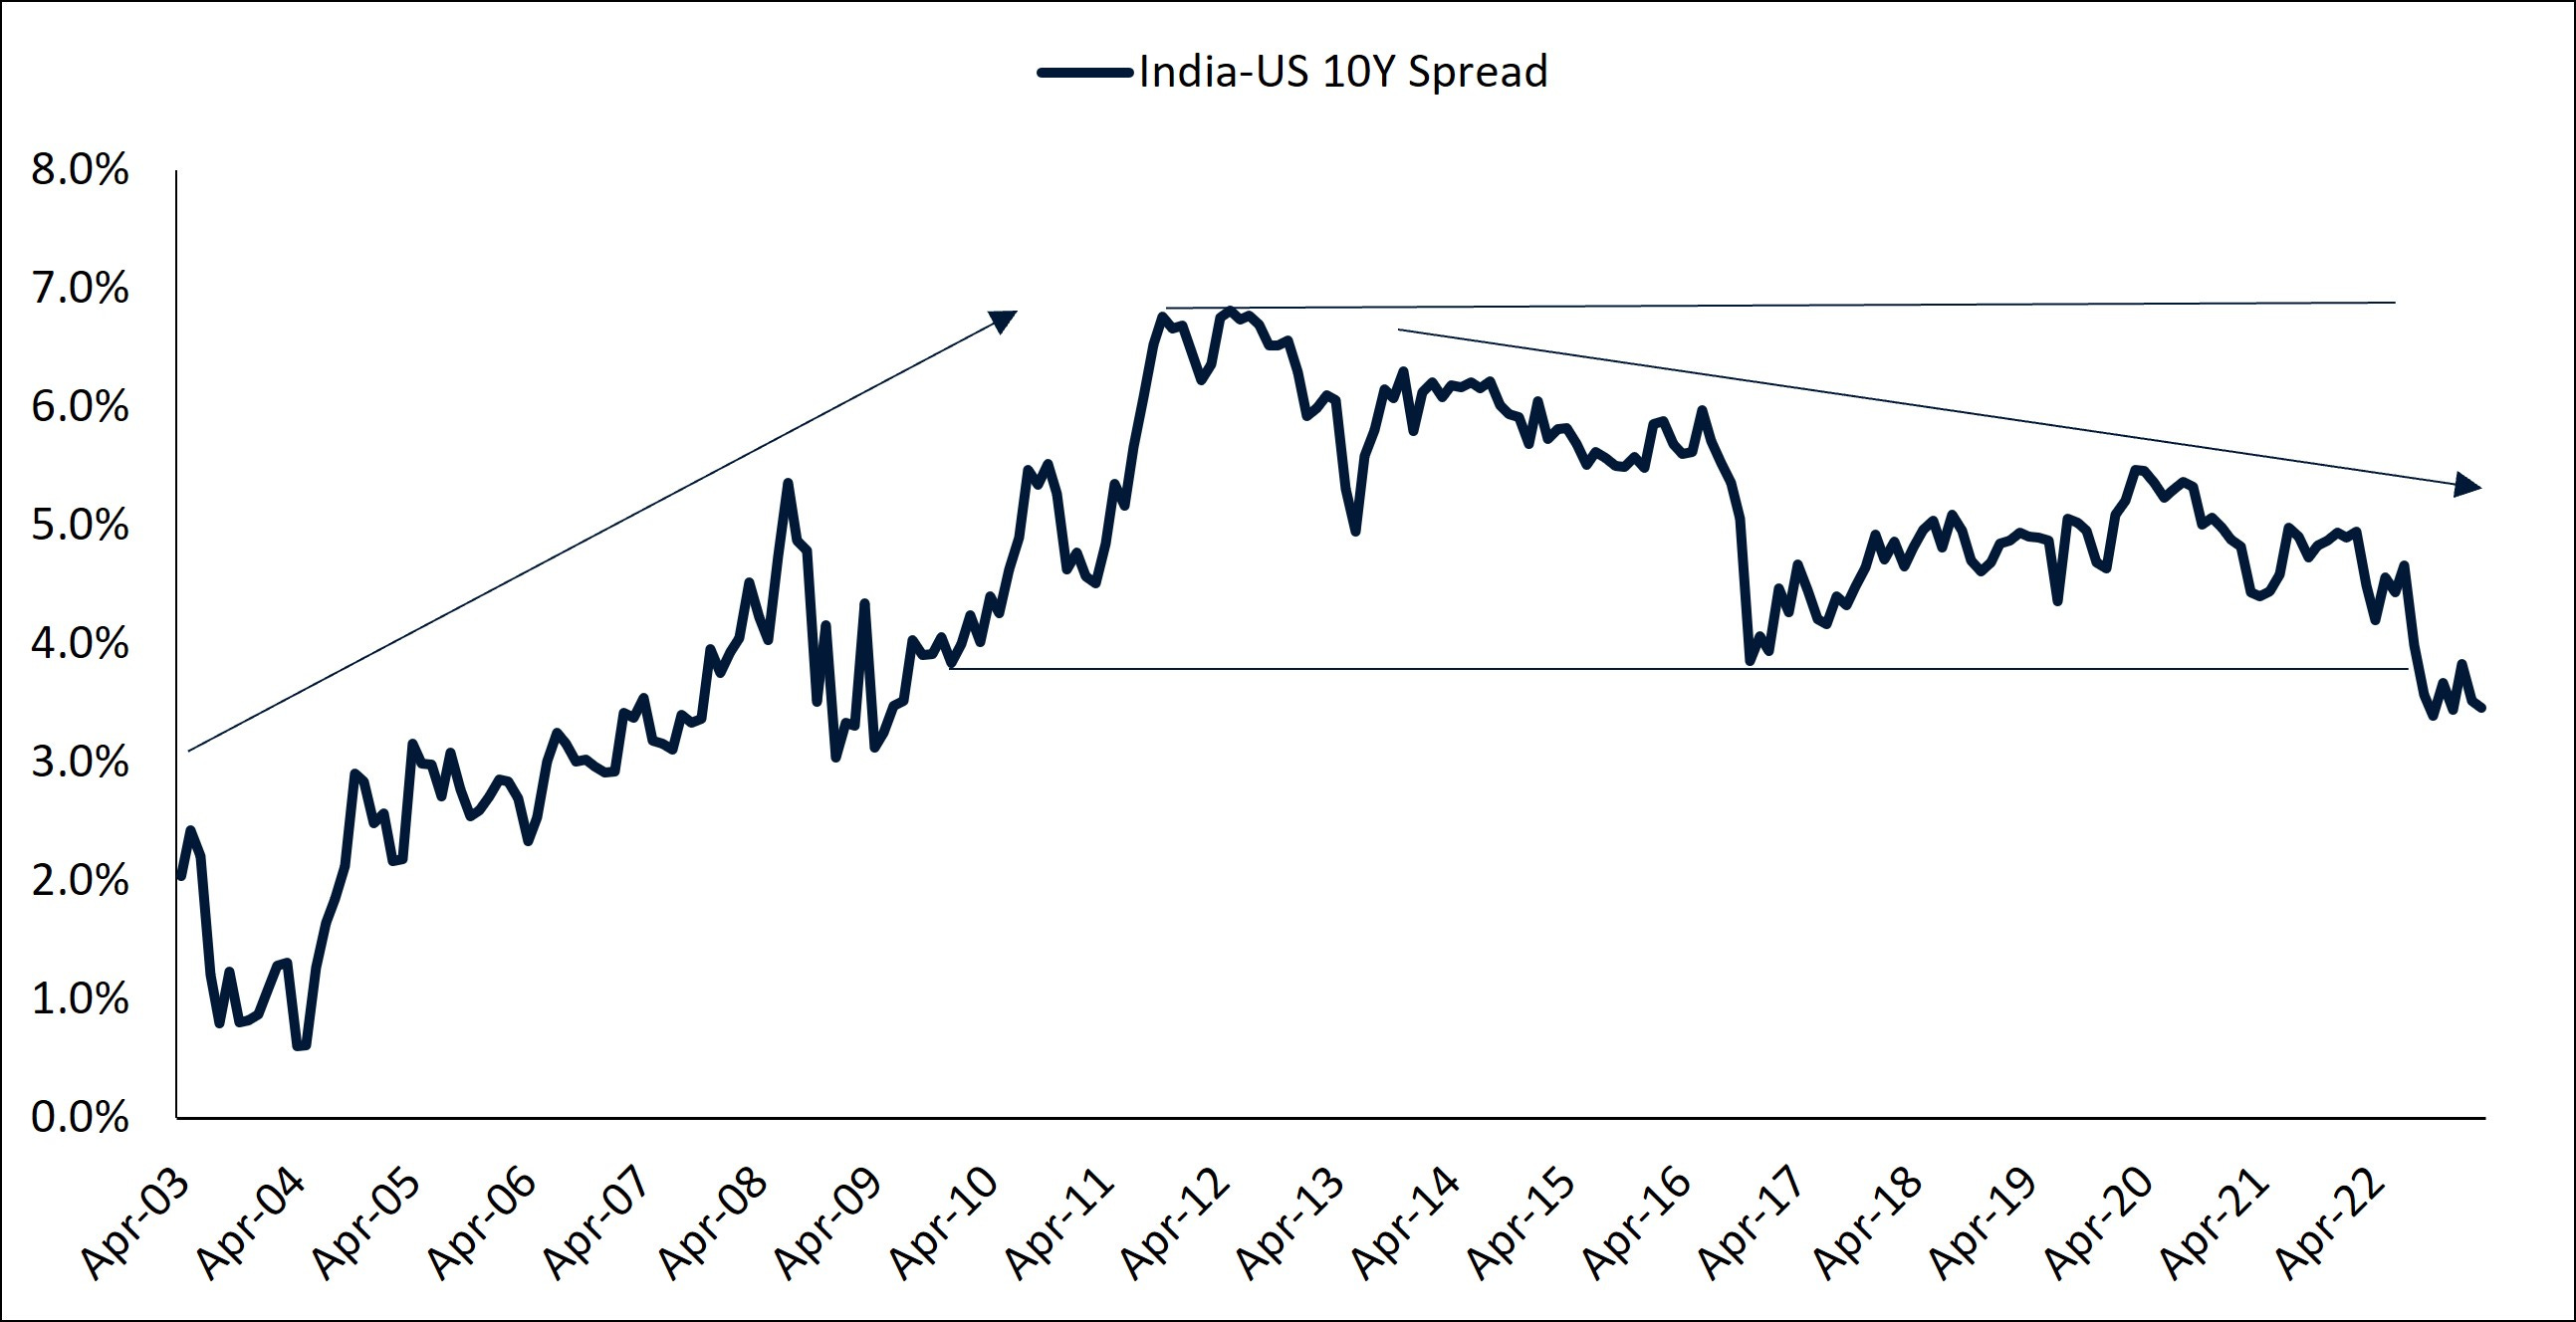
Looking back, the spread has risen till 2011-2012, post which it has started to slowly come down.
However, it is important to note that while it may seem like it has come down overall since 2011-2012 (which make sense seeing as India is developing) - between this overall slow negative trend over the past ~10Y, there are plenty of ups and downs.
NIFTY 50 and the 10Y Spread
So, here’s the way I went about it:
We would be taking the moving average of US-India 10Y spread for the past 12 months (Monthly closing spread of T-2 to T-14)
Then, we compare that to the beginning spread of the month (closing spread of the previous month, i.e, T-1) - this is essential to prevent a look-ahead bias.
If the spread was lower than average, we’d label it as 0, if it was higher or equal to the average, labeled it 1
Similarly, if NIFTY 50’s return for that month was higher than or equal to 0.0%, 1, if lower than 0.0%, we label it as 0
We calculated this for every month for the past 20 years
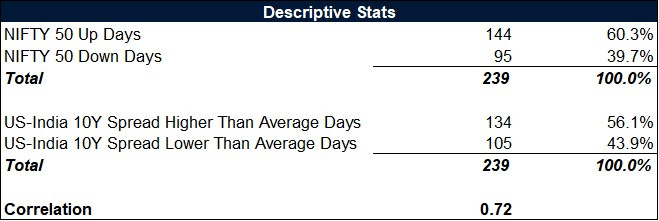
Fun stats, the correlation was 0.72 (which is pretty high)
Now, remember, this isn’t the quantum of returns but rather if it was just positive or negative returns, moreover, correlation is well, just if they moved together
So, I decided, okay then, let’s put this into a logistical regression
Sidenote for folks not familiar with logistical regression:
Not diving too deep, when predicting something through data, usually you can go one of two routes:
Give an estimate - say the temperature tomorrow is going to be 34C or
Give a classification - temperature tomorrow is going to be hotter than today
When we go for classification problems, say chance of tomorrow being hotter than today, what we essentially predict is the probability that tomorrow would be hotter than today
Just like how we use regression - which basically is a stat technique that creates an algebra equation (yup same thing you learnt in middle school) to predict an estimate
Logistical regression is a stat technique that creates an equation that determines the probability of a classification happening - i.e. chances that tomorrow would be hotter than today or in our case, chances the NIFTY would give a positive return
Coming back, we ran the stats model and here are the results:
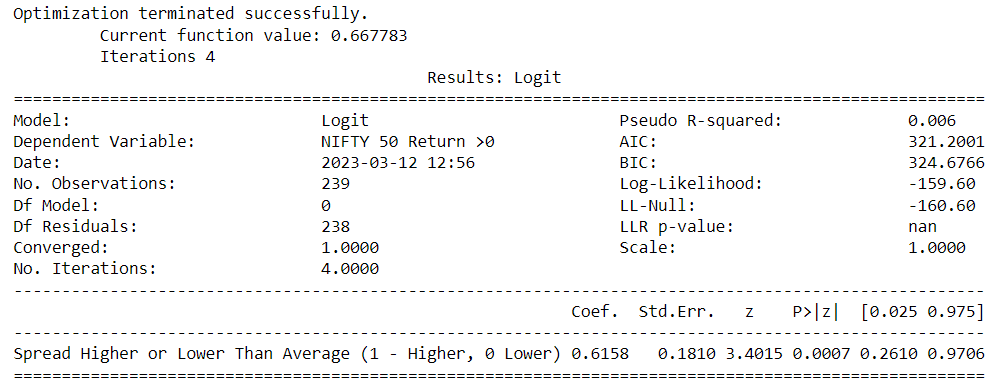
If this looks too math heavy or cryptic, don’t worry, here’s the takeaway
The two factors that are worth looking at are the “Pseudo R-Squared” and the “P >|z|”
Pseudo R-Squared: Without getting too technical, this is a measure of robustness of the model (it’s called pseudo since this is a classification probolem), at 0.006, that’s far too low for the model to be called robust
P >|z|: Essentially the P value, this should be < your significance level (commonly 5%) for the variable to be considered as a good predictor- here is pretty low at 0.0007
The thing here is, while the variable seems to be a good predictor in this sample, the model itself is not “robust” i.e. the results of it being a good indicator is probably a coincidence or just simply not good enough :(
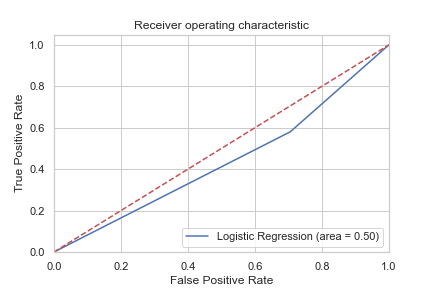
Here’s an easy way to interpret the above “ROC Curve” - The dotted line represents the ROC curve of a random classifier; a good classifier stays as far away from that line as possible and towards the top-left corner.
So, as you can see, its towards the right bottom and is not that far from the dotted line - in simpler words, it’d probably throw out a lot of false-positives
Takeaway
This was a little heavy on the jargon, but the takeaway is simpler:
The US-India 10Y Spread that exists certainly does seem to be a variable worth looking out when evaluating NIFTY, they do have a tendency to move together
At the same time, it alone is probably a poor indicator of how NIFTY might do, although it may help a bit to understand some moves, it probably is best used as a supplement, there’s also a chance that there’s something else that actually affects both the spreads and NIFTY returns instead and it may be worth finding out what
The spread has overall been on a declining trend for the past few years which could be attributed to the overall economic conditions of both the economies
Lastly, even before 2008 the spread between the two countries was growing and kept growing till 2011-12, post which it started to decline, so it may not be wise to apply the same logic based on what happened with bond spreads in 2008 to predict something that can happen in 2023 or beyond - there might be a tendency to correlate the next crisis to the last previous one due to a recency bias but it is important to understand the context.
Hope you had as much fun reading this article as I did writing it - please feel free to drop in comments below asking for elaboration and your thoughts - I’d love to chat!
Until next time, keep manifesting wealth!
Disclaimer: All above views are purely for educational purposes and are not to be taken as investment advice. Investment or trades taken of any kind based on this are solely the person’s risk and I bear no liability. Please consult a financial advisor before making any investments. All investments are subject to market risks.
Website: Manifestwealth.substack.com
Twitter: @Manifest_W
LinkedIn: Manifest Wealth
Sources:
Investing.com
Google Images