


Manifest Wealth: The logic behind "Working Capital Days"
This content is part of our Financial Awareness Initiative and is a deep down on logic behind Financial Concepts

Alot of us in our quest for understanding finance would have learnt about working capital, we covered what is working capital just last week! Click here to see that post!
However, questions that almost arises in everyone’s mind who wants to know the logic behind the formula are:
“Why is 1/Inventory Turnover multiplied by 365 is the holding period?”
“Why is 1/Receivables Turnover multiplied by 365 is the credit period offered to customers?”
“Why is 1/Payables Turnover multiplied by 365 is the credit period offered by suppliers?”
The Answer:
Let’s remove the finance jargon and focus on your daily milk provider.
The milk provider gives you your milk worth Rs.10 every day for a month, and you pay them the total at the end of the month.

Average Days in a Month is 365/12 so hence accounting for decimals your Monthly cost is Rs. 304.17.
Now since you pay after you get the milk, we can assume you have a credit period, and since you do it at the end of the month, its ~30 Days or one month.
One thing to note here is you’re not paying on an everyday basis, as for the Milk Provider you’ve subscribed at beginning of the month.
It’s just money that is collected at the end of the month, and the milk is just delivered Everday as per the understanding between you both.
Now this number - 30 days is important for the milk provider and the investor as it allows them to know how quickly the understanding between customer and them turns into cash which can be used in the business activities.
Clear so far?
Now let’s change the perspective to that of the milk provider.
You have promised the individual you’d pay them after ~30 days.
Now assuming you begin at Jan 2021 the payment schedule looks like follows:
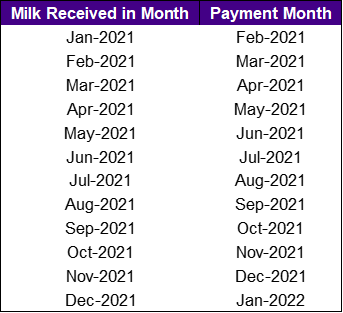
So, by looking at the above, you’d have noticed how the milk at the end of the year would be paid for in the next year’s first month.
Now let’s see what the Milk Provider’s Financials would look like at the end of the year on 31st Dec 2021 if the only customer were you!
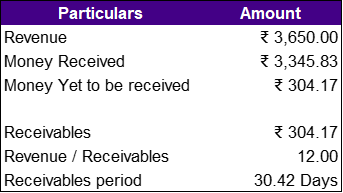
As you see the revenue for the year would be Rs.10*365 (Rs.10 Milk Everday) or Rs. 3650.00 and the average monthly amount remaining that’d be given in January is 304.17.
Hence, their Revenue is Rs. 3650.00 and Receivables are Rs.304.17
Their Debtors Turnover Ratio hence is 12x.
And if we were to do the days calculation of 1/DTR*365 we’d get 30.42 Days or Average Days in a Month.
Seems Familiar? oh yeah, it’s the frequency at which you pay the Milk Provider!
Fun huh?
Reasoning:
Now as a business, nobody has one customer, some pay faster, some slower. Similarly, tracking how long a product was in the inventory before it sold is time consuming and expensive, especially if the goods are large in number like pens. Lastly, we don’t know how fast someone would ask for their money, some may give us time some may not.
A business may have terms internally to help track the above, however as an outsider we may not have the data to calculate this on a per individual basis.
Hence, we settle for the formula above as it gives the average time somebody takes to pay the money due or ask the money we owe them or simply how fast the inventory moves.
Weekly view on NIFTY And BANKNIFTY - Every Sunday at 11AM IST
Articles on Financial Concepts - Every Saturday at 11AM IST
Quality Financial Research - Every 2nd Saturday of the month 4PM IST
A look into my portfolio - Every 4th Saturday of the month, 4PM IST