

Where does NIFTY 500 stand with the US 10Y hitting ~5%?
Where does NIFTY 500 stand with the US 10Y hitting ~5%?
Exploring the relationship between the US 10Y and NIFTY 500

Hi,
It certainly has been a while.
With last week being tepid for NIFTY 500 (although overall it was down only ~3%) and everyone going bonkers over US10Y Yield hitting 5%, one may wonder, is there a relationship between them?
And more importantly, where does NIFTY 500 stand?
Let’s begin
Setting the Context:

Over the past 20+ years, the US10Y spread and the next 360 trading days forward return of NIFTY do seem to move almost together with a linear relationship.
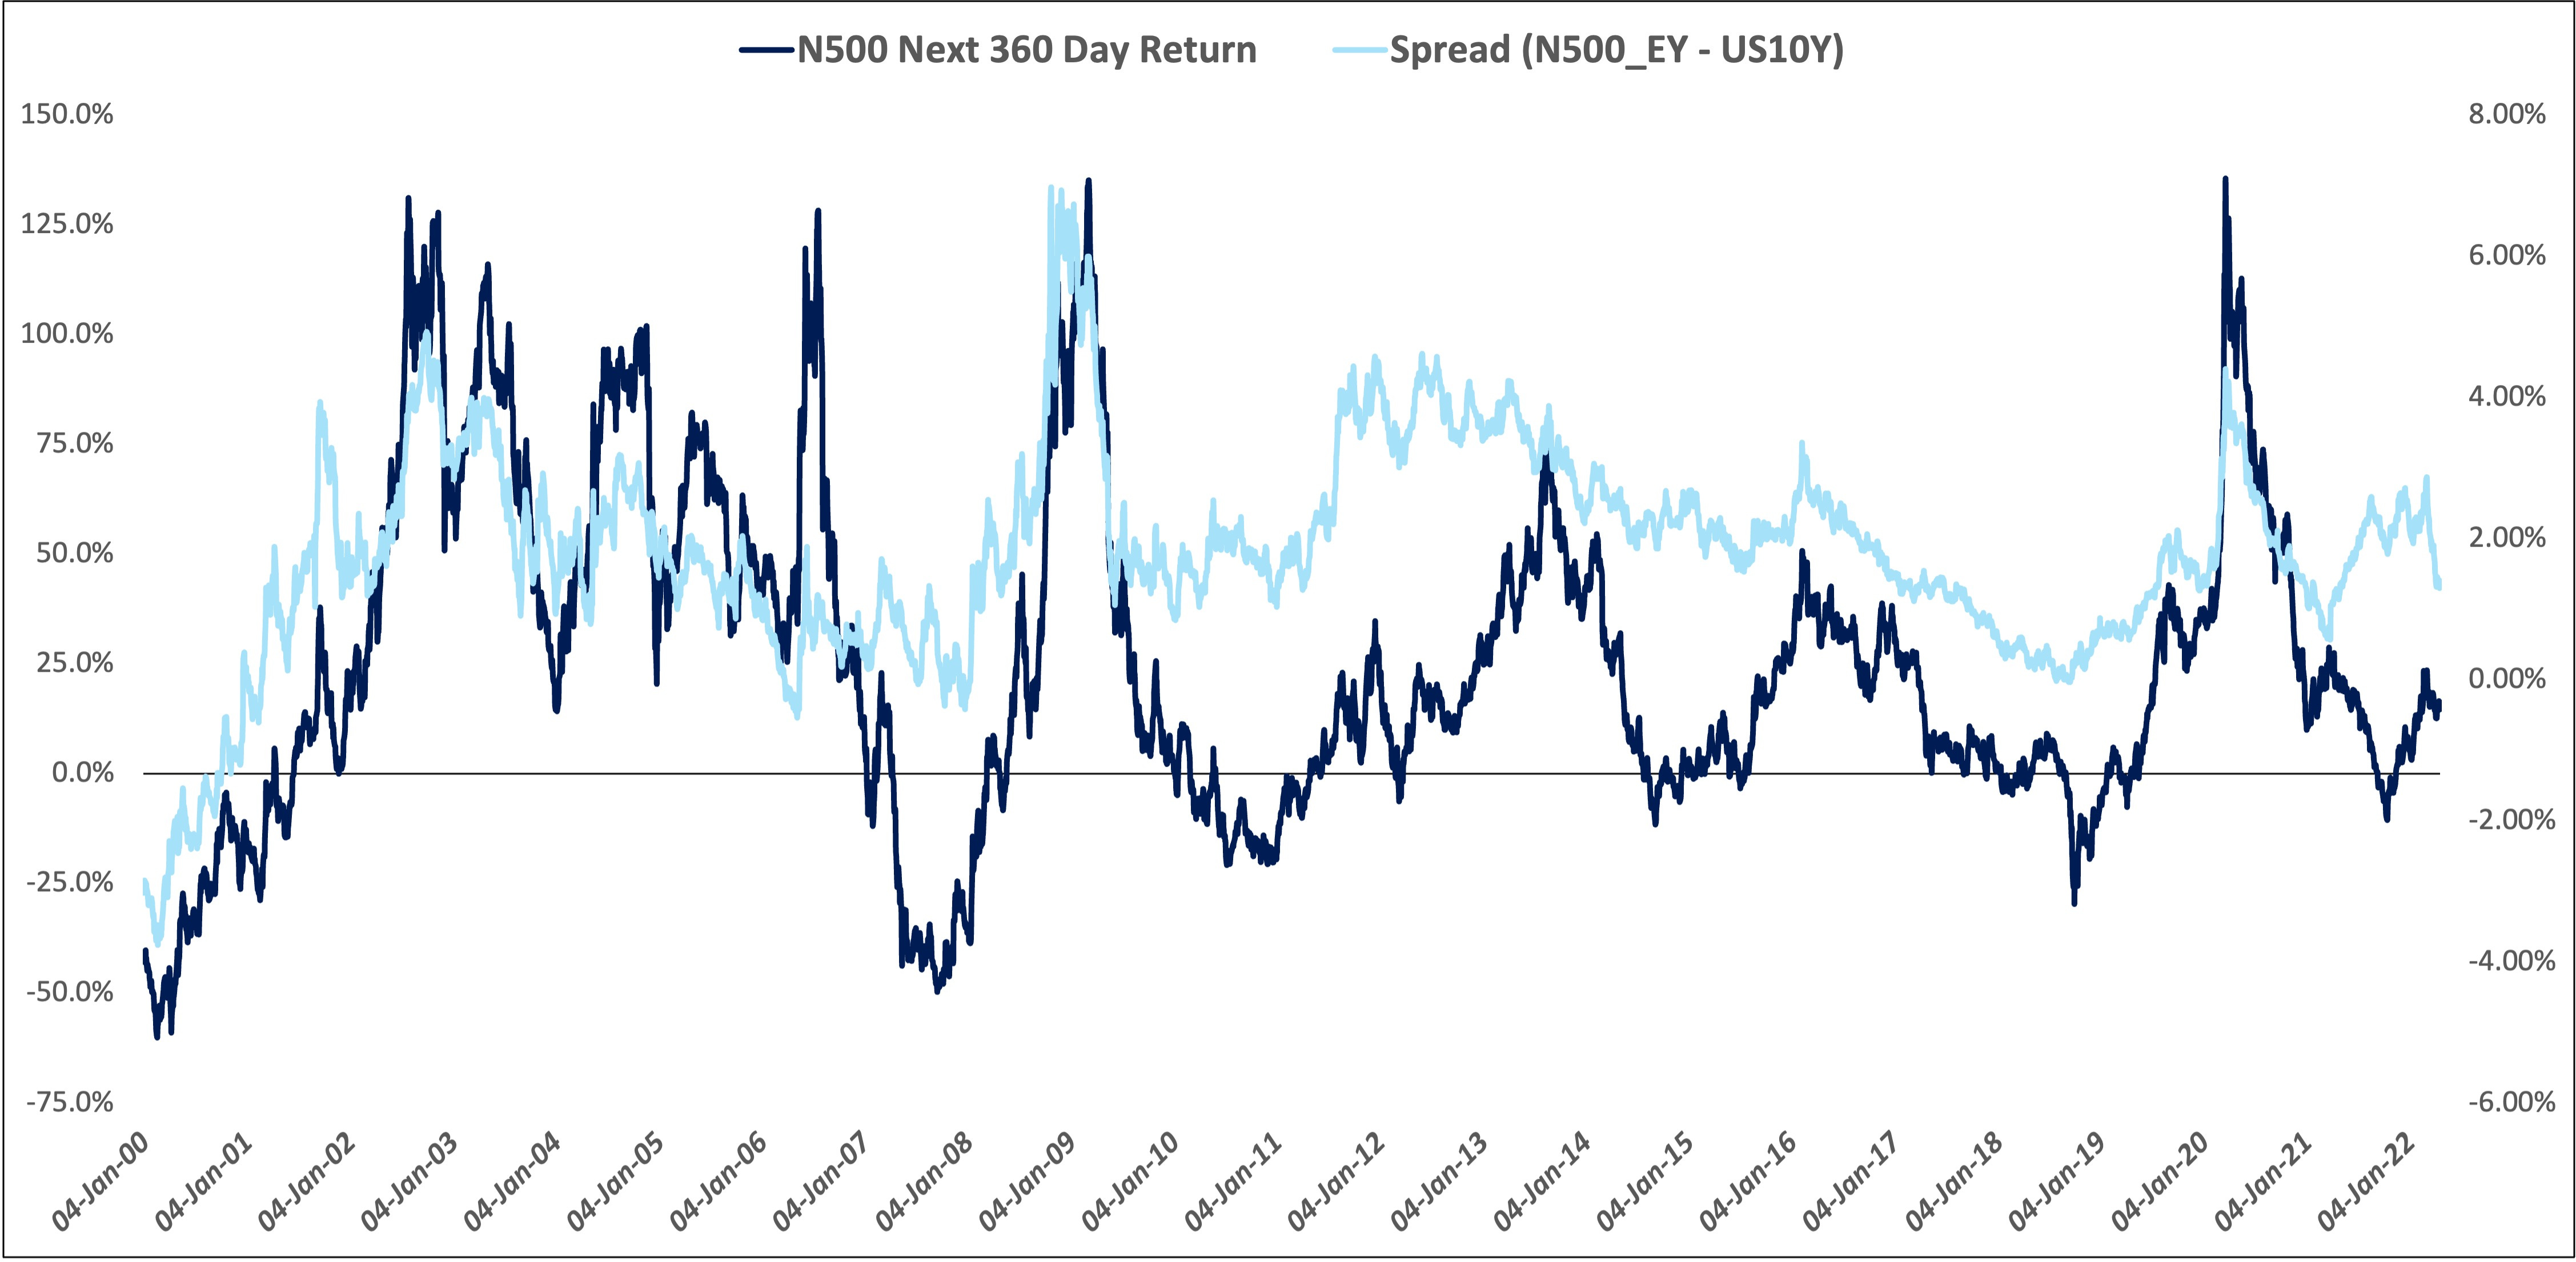
Even if I were to add the angle of time to the above, it does show that the relationship isn’t just concentrated on one specific period of time.
The rationale here of course is simple; as the spread between the NIFTY 500 EY and US10Y Yield reduces, NIFTY becomes less attractive since it’s essentially takes the NIFTY PE and adds the context of the current yield being offered by the US bonds (i.e one of the “least” riskiest bonds), which ideally would also show up with flows moving out of equity markets.

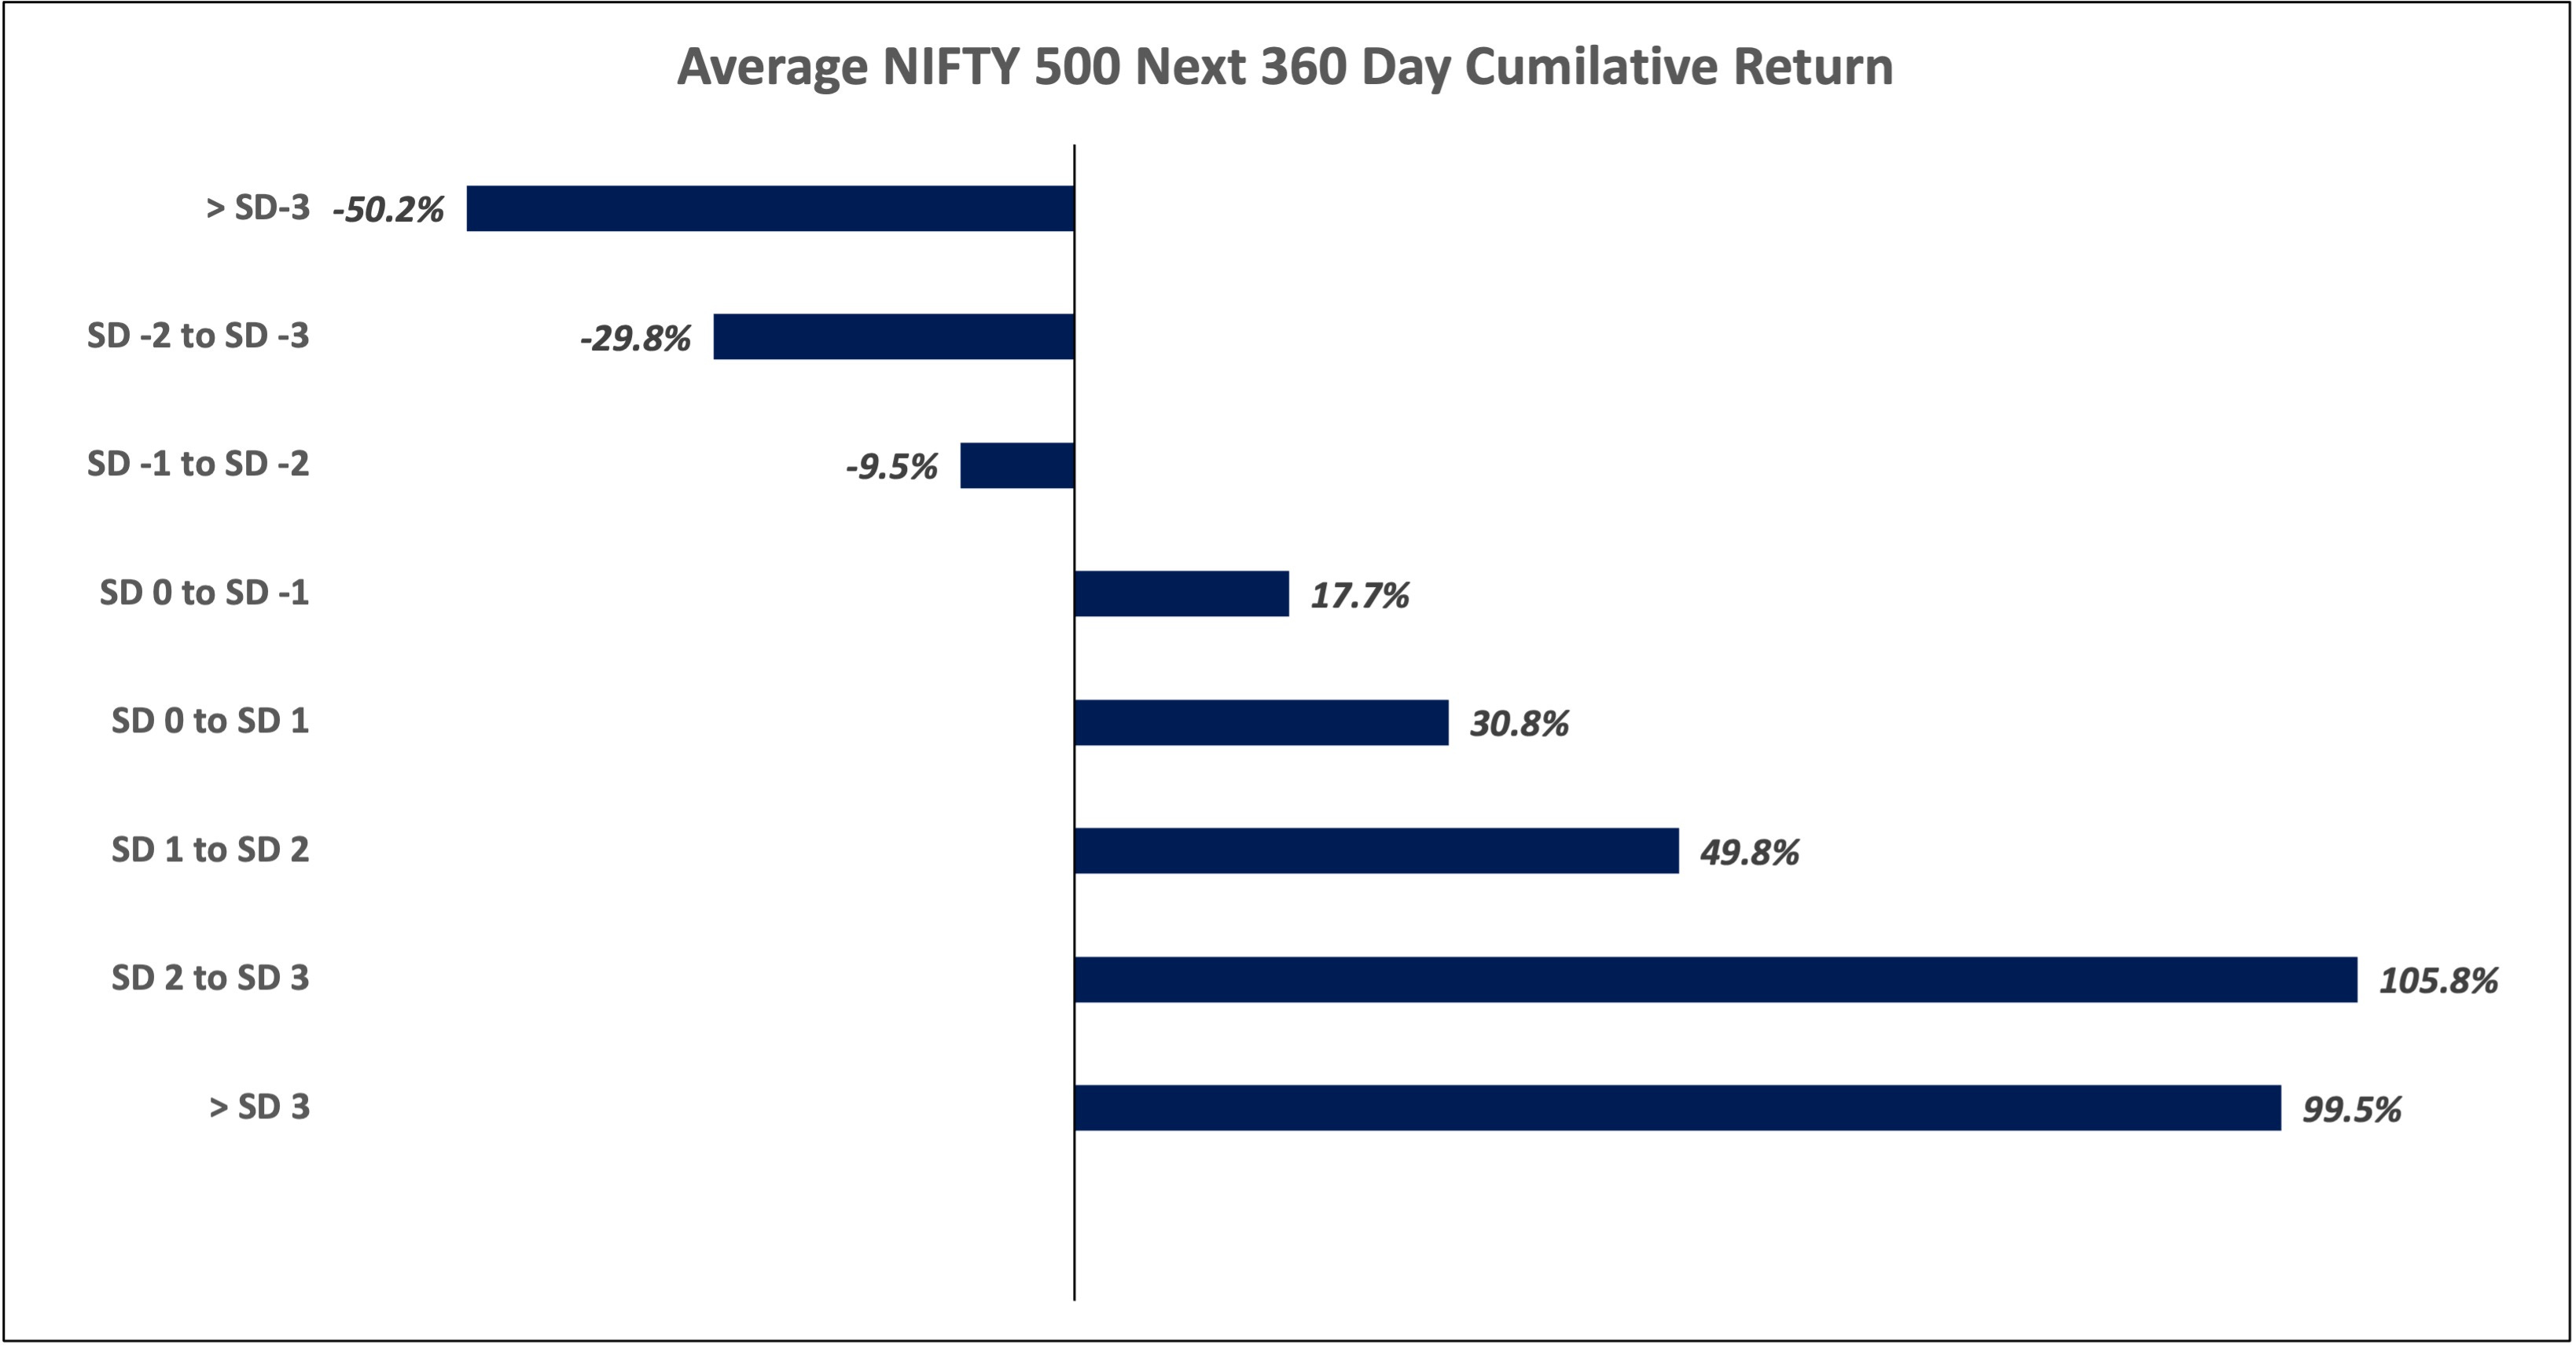
Slicing the next 360 day forward return across the bucket of spreads ranges, it becomes even more clear that anytime the spread has gone below 0.3%, NIFTY on average has delivered negative returns in the next 360 day trading period.
Current Scenario
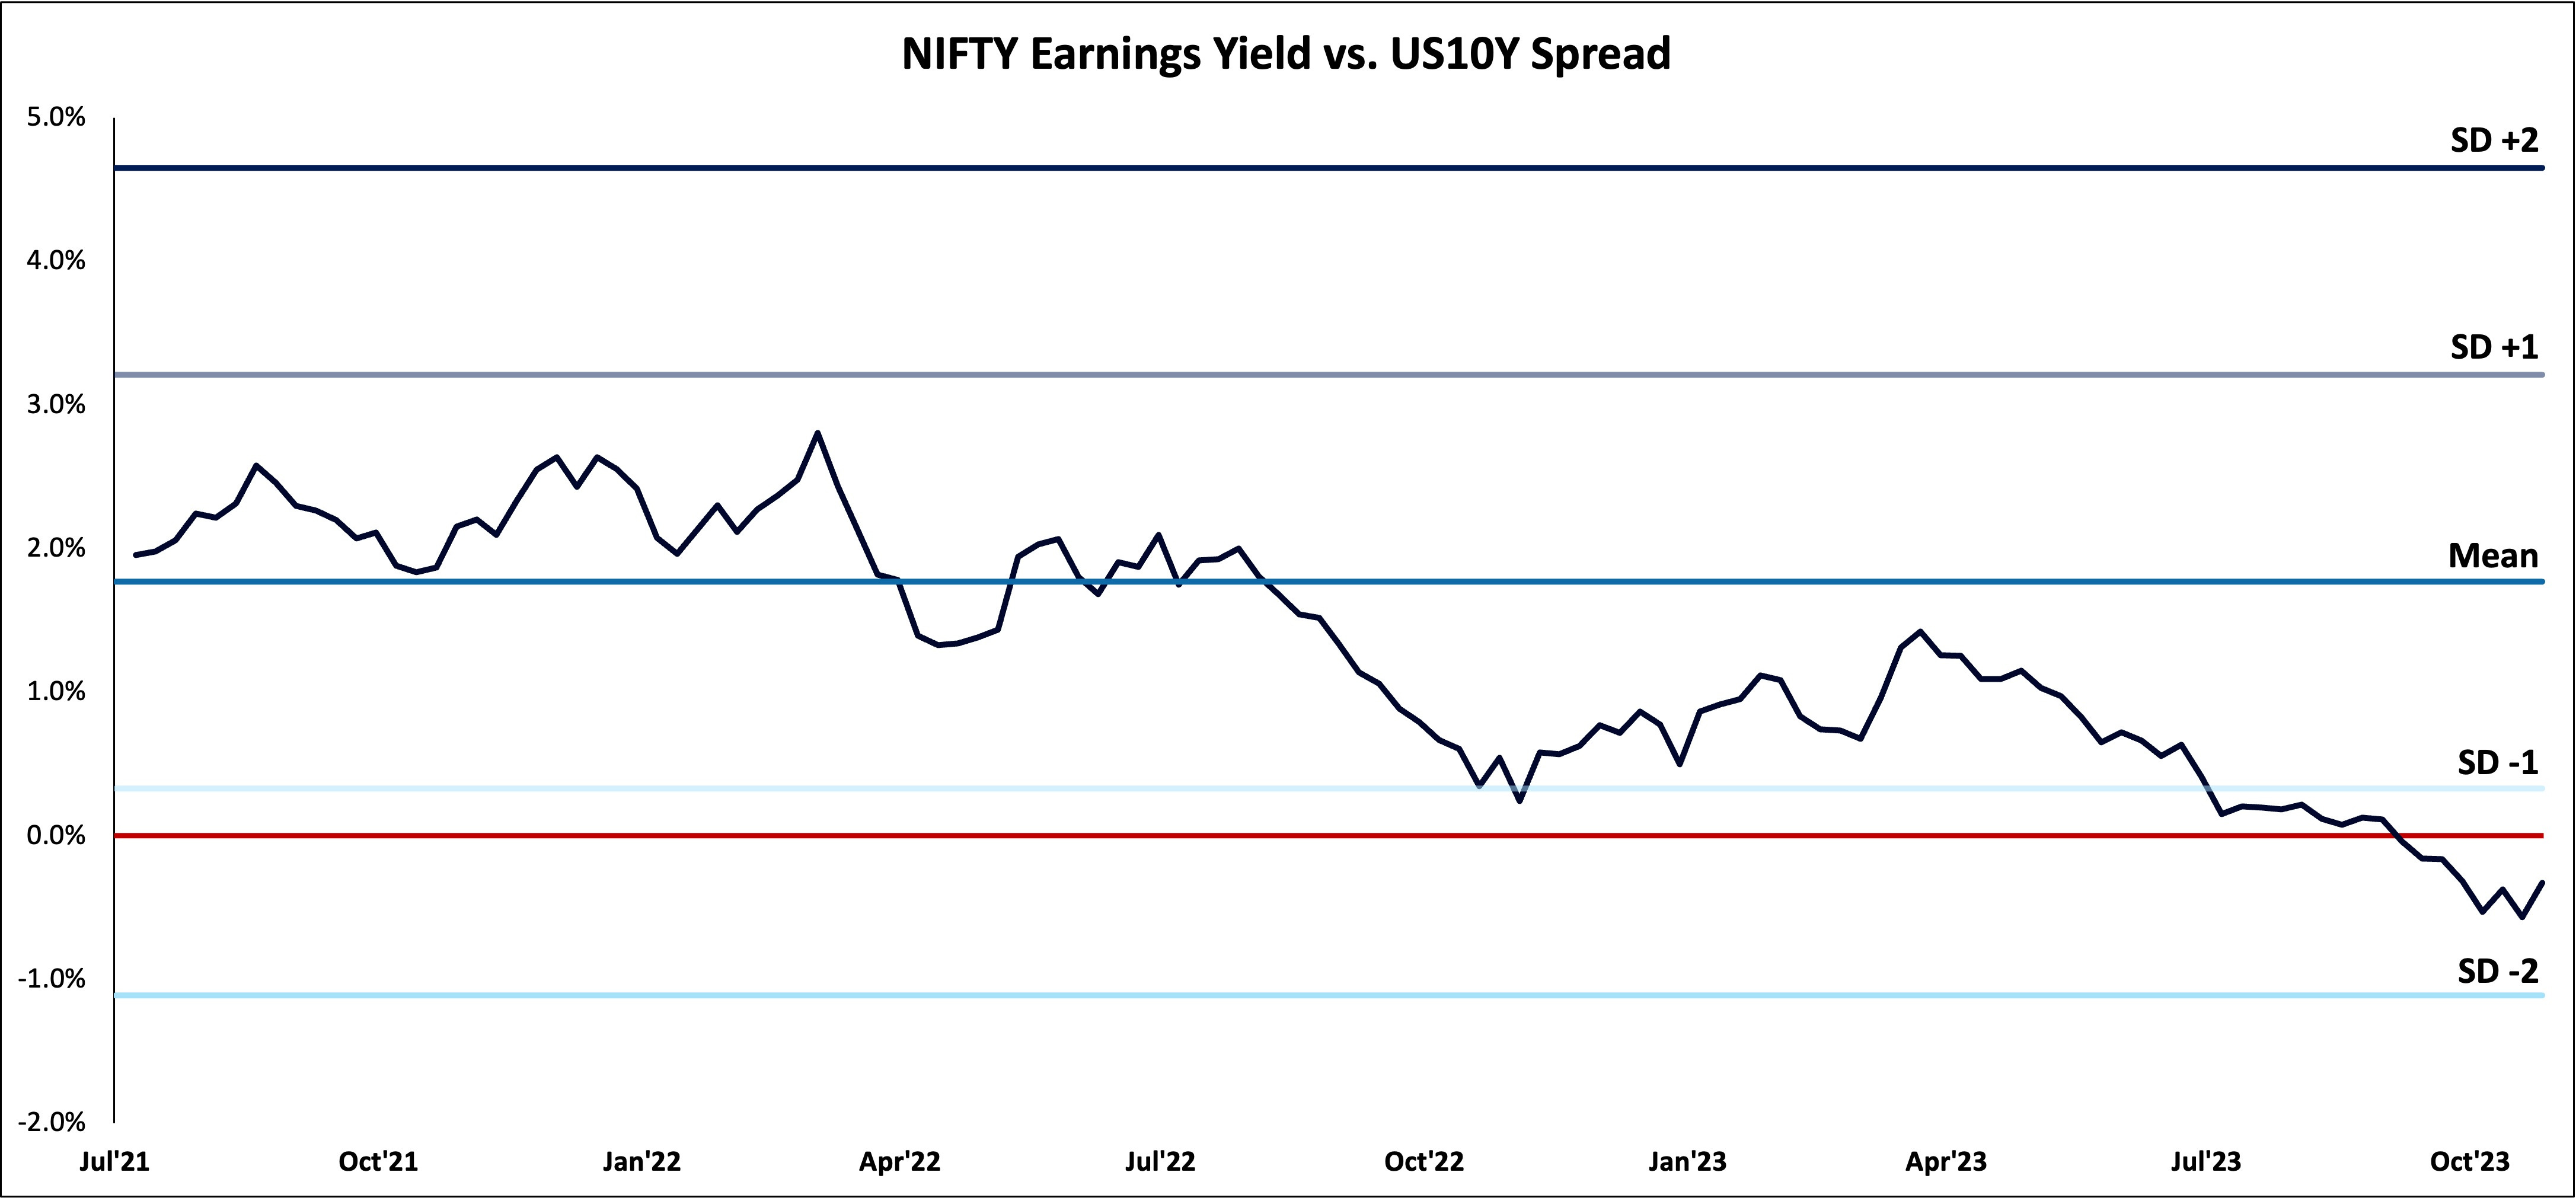
Currently, the NIFTY EY-US10Y spread is not only below 0.3%, but is negative. i.e right in the SD -1 to SD -2 Bucket, where the average NIFTY 500 cumulative return for the next 360 trading days is around -9.5% and Median is about -13.0%, the lowest it has gone is -48% but has also has given +73% on the highest end.
So it does look like volatile times are ahead with a negative bias.
Conclusion:
Well, so that’s that, basis the current spread, looks like NIFTY may not do that well and as such, despite the recent fall that might’ve sent panic across investors, it may not have been enough to tip the scales in favour of NIFTY’s valuations.
Now, this is just one data point, so no matter how good it looks on paper, it shouldn’t solely drive your decisions.
Personally, I’m continuing my SIPs as always but my current allocation in equities is lower than it used to be. Hopefully, things change around quickly.
Until next time, keep manifesting wealth.
How my view has evolved over this year on NIFTY:
Now back in Jan while making the market outlook for the year, my view was of caution, that NIFTY could underperform, given the valuations and the return streak of NIFTY 50, but overall it’d be wise to continue doing the SIPs. Bells, not alarms or sirens.
Come July, the view went from caution to just being overall negative with regards to valuation. Alarms, not sirens.
Taking that view, I personally started to move away from equity slowly over time in my tactical portfolio, adding excess cash to debt and safer haven assets, while continuing with SIPs.
And now we are here, where I’m currently just adding sips, with the rest being in safe haven assets and plenty of cash to deploy
I also update folks with where my portfolio stands on twitter (X)


Disclaimer 1: All above views are purely for educational purposes and are not to be taken as investment advice. Investment or trades taken of any kind based on this are solely the person’s risk and I bear no liability. Please consult a financial advisor before making any investments. All investments are subject to market risks.
Disclaimer 2: The views presented above are mine and not of any organization(s) I work with / am employed at
Sources:
NIFTY Indices
Investing.com